
The US dollar remains bullish against major currencies. The dollar index (DXY) broke above 100 in early trading today as it reached a high of 100.54.
USDJPY is up 2.5% so far this week and it broke 146.00 earlier today. All three short term and mid term moving averages are slopping upward. Price is being supported by these dynamic support levels, which confirms the upward trend.
A correction toward the moving average MA(30) is expected before continuing the upward trend. Eyes on the 145.00 psychological level.
USDJPY 1H Chart
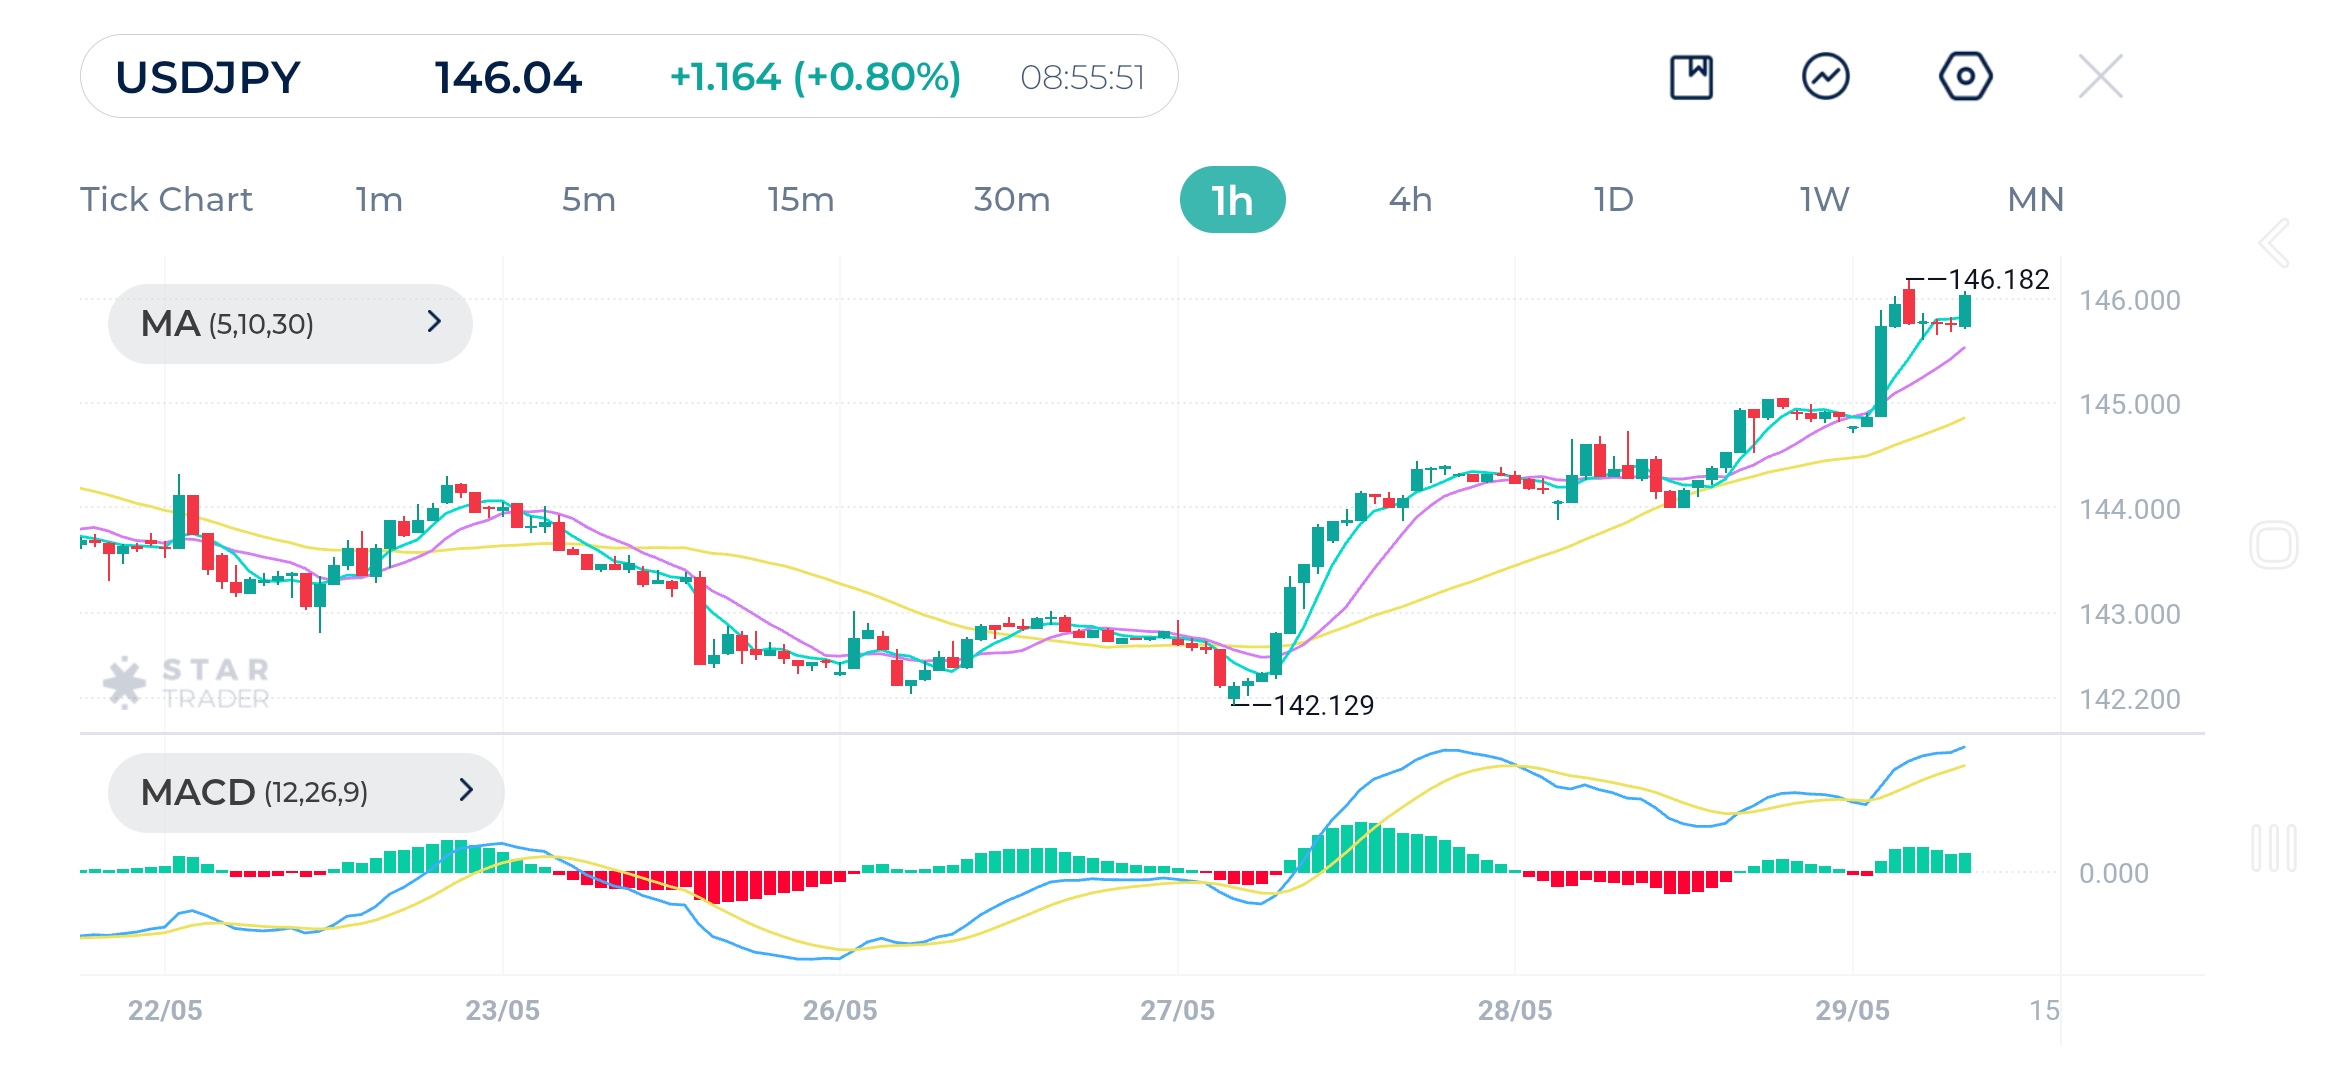
| Resistance | 146.30 | 146.73 | 147.13 |
| Support | 145.60 | 144.77 | 144.36 |
Gold is declining as the US dollar strengthens. The precious metal fell below $3,250 in early trading today. The selling pressure continues as the technicals show strong bearish momentum. MACD shows slight upward correction on the hourly chart which may drive the price up to the $3,280 level before continuing with the downward movement.
The dynamic resistance level of moving average MA(30), which coincides with the $3,300 is important watch as selling pressure at this level might keep prices lower. A bullish crossover of MA(5) and MA(10) could push prices higher to the aforementioned levels before continuing the downtrend.
Gold 1H Chart
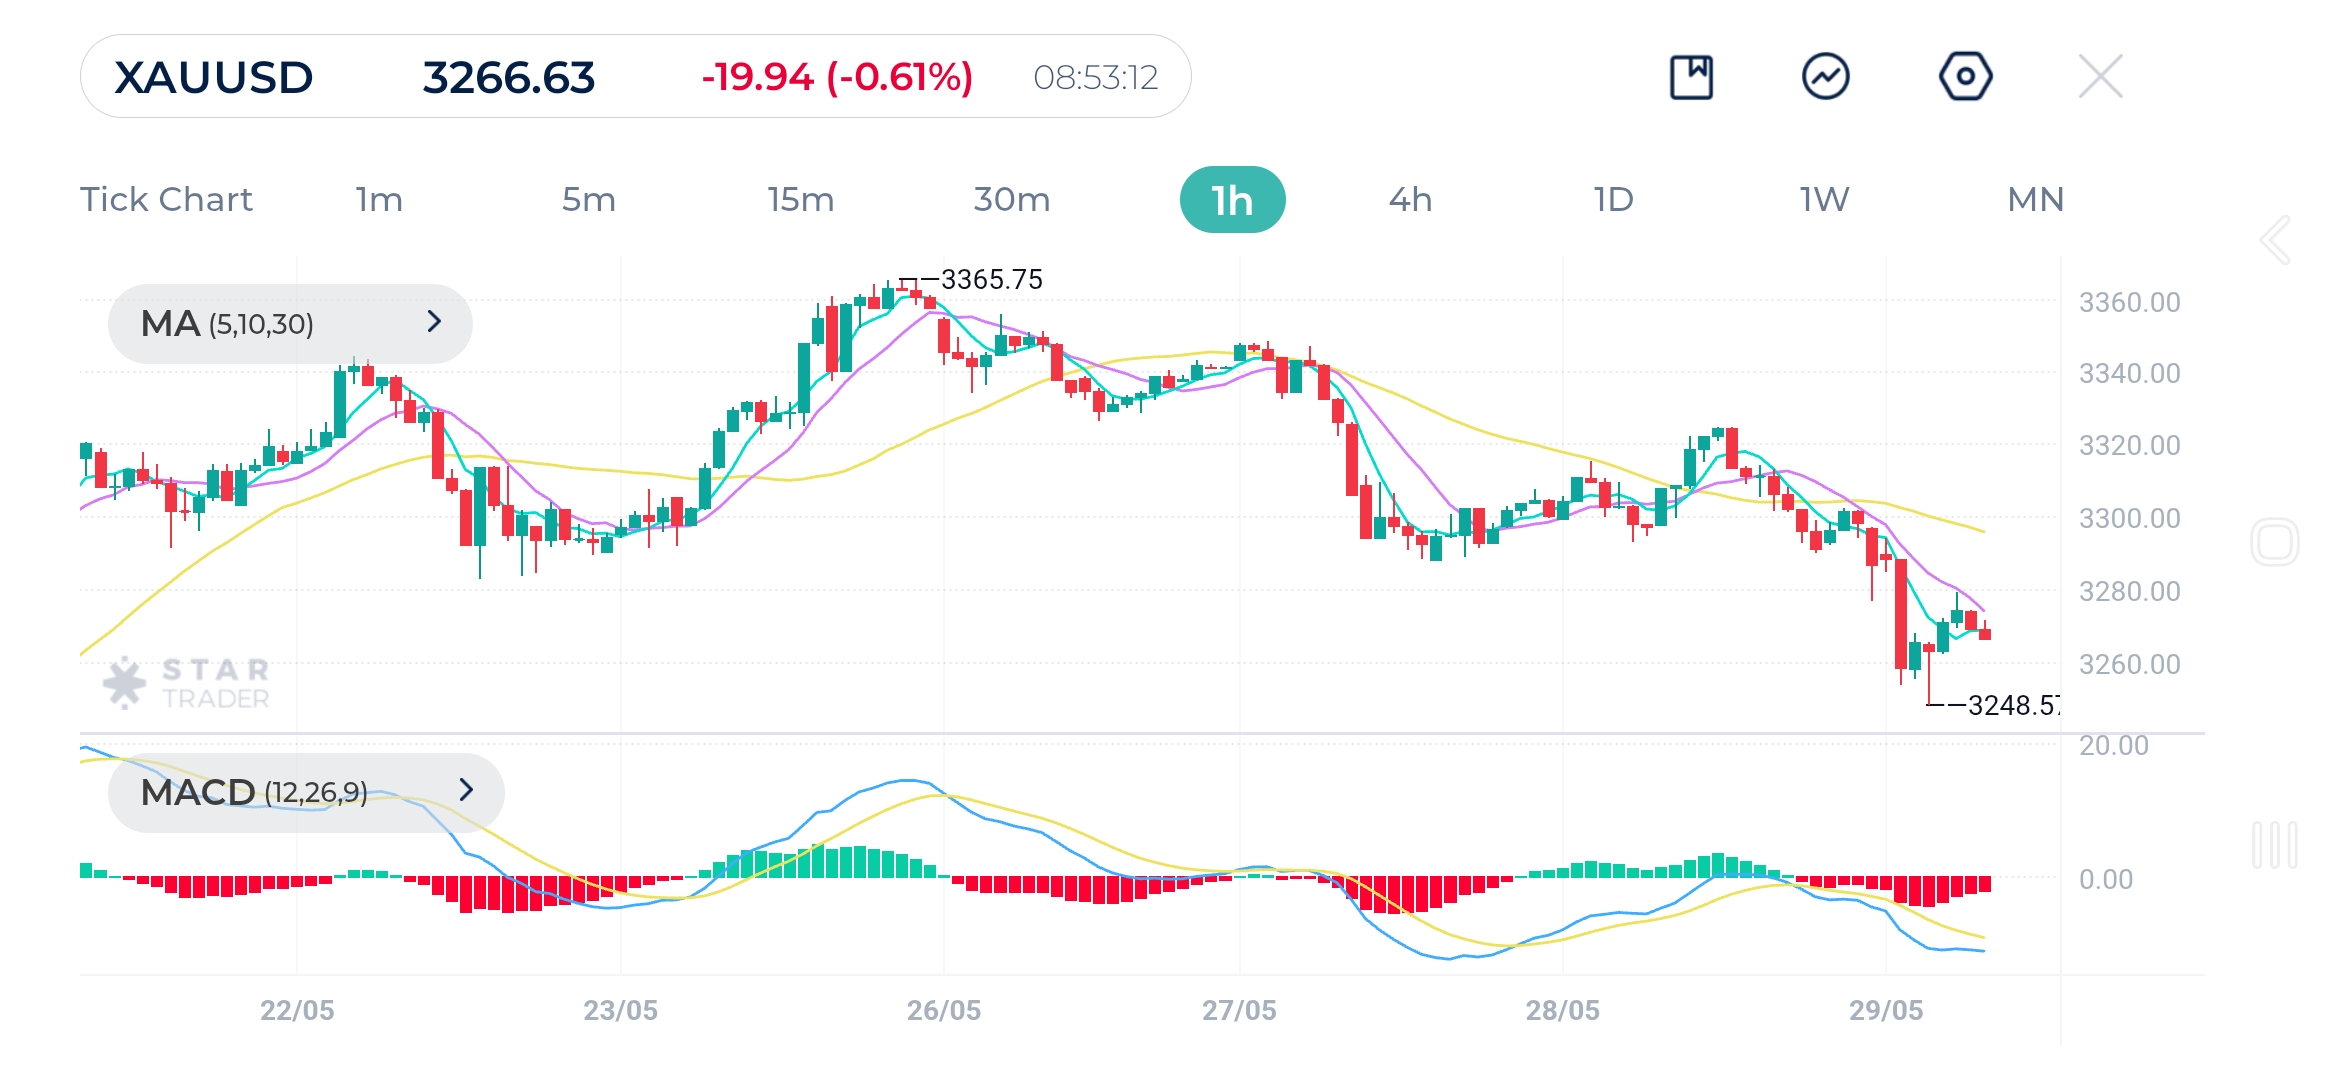
| Resistance | $3,283 | $3,295 | $3,316 |
| Support | $3,259 | $3,245 | $3,232 |
US indices have been trending upward this week. The upward trend is expected to continue for the the rest of the week, however a bearish correction is expected before breaking this week’s high.
The Dow jones shows a strong uptrend on the hourly chart. Moving average MA(30) is trending upwards, which confirms the bullish momentum. MACD is still positive. We might see a correction towards MA(10) in today’s trading before continuing upwards. Eyes on the 42,500 levels.
Dow Jones 1H Chart
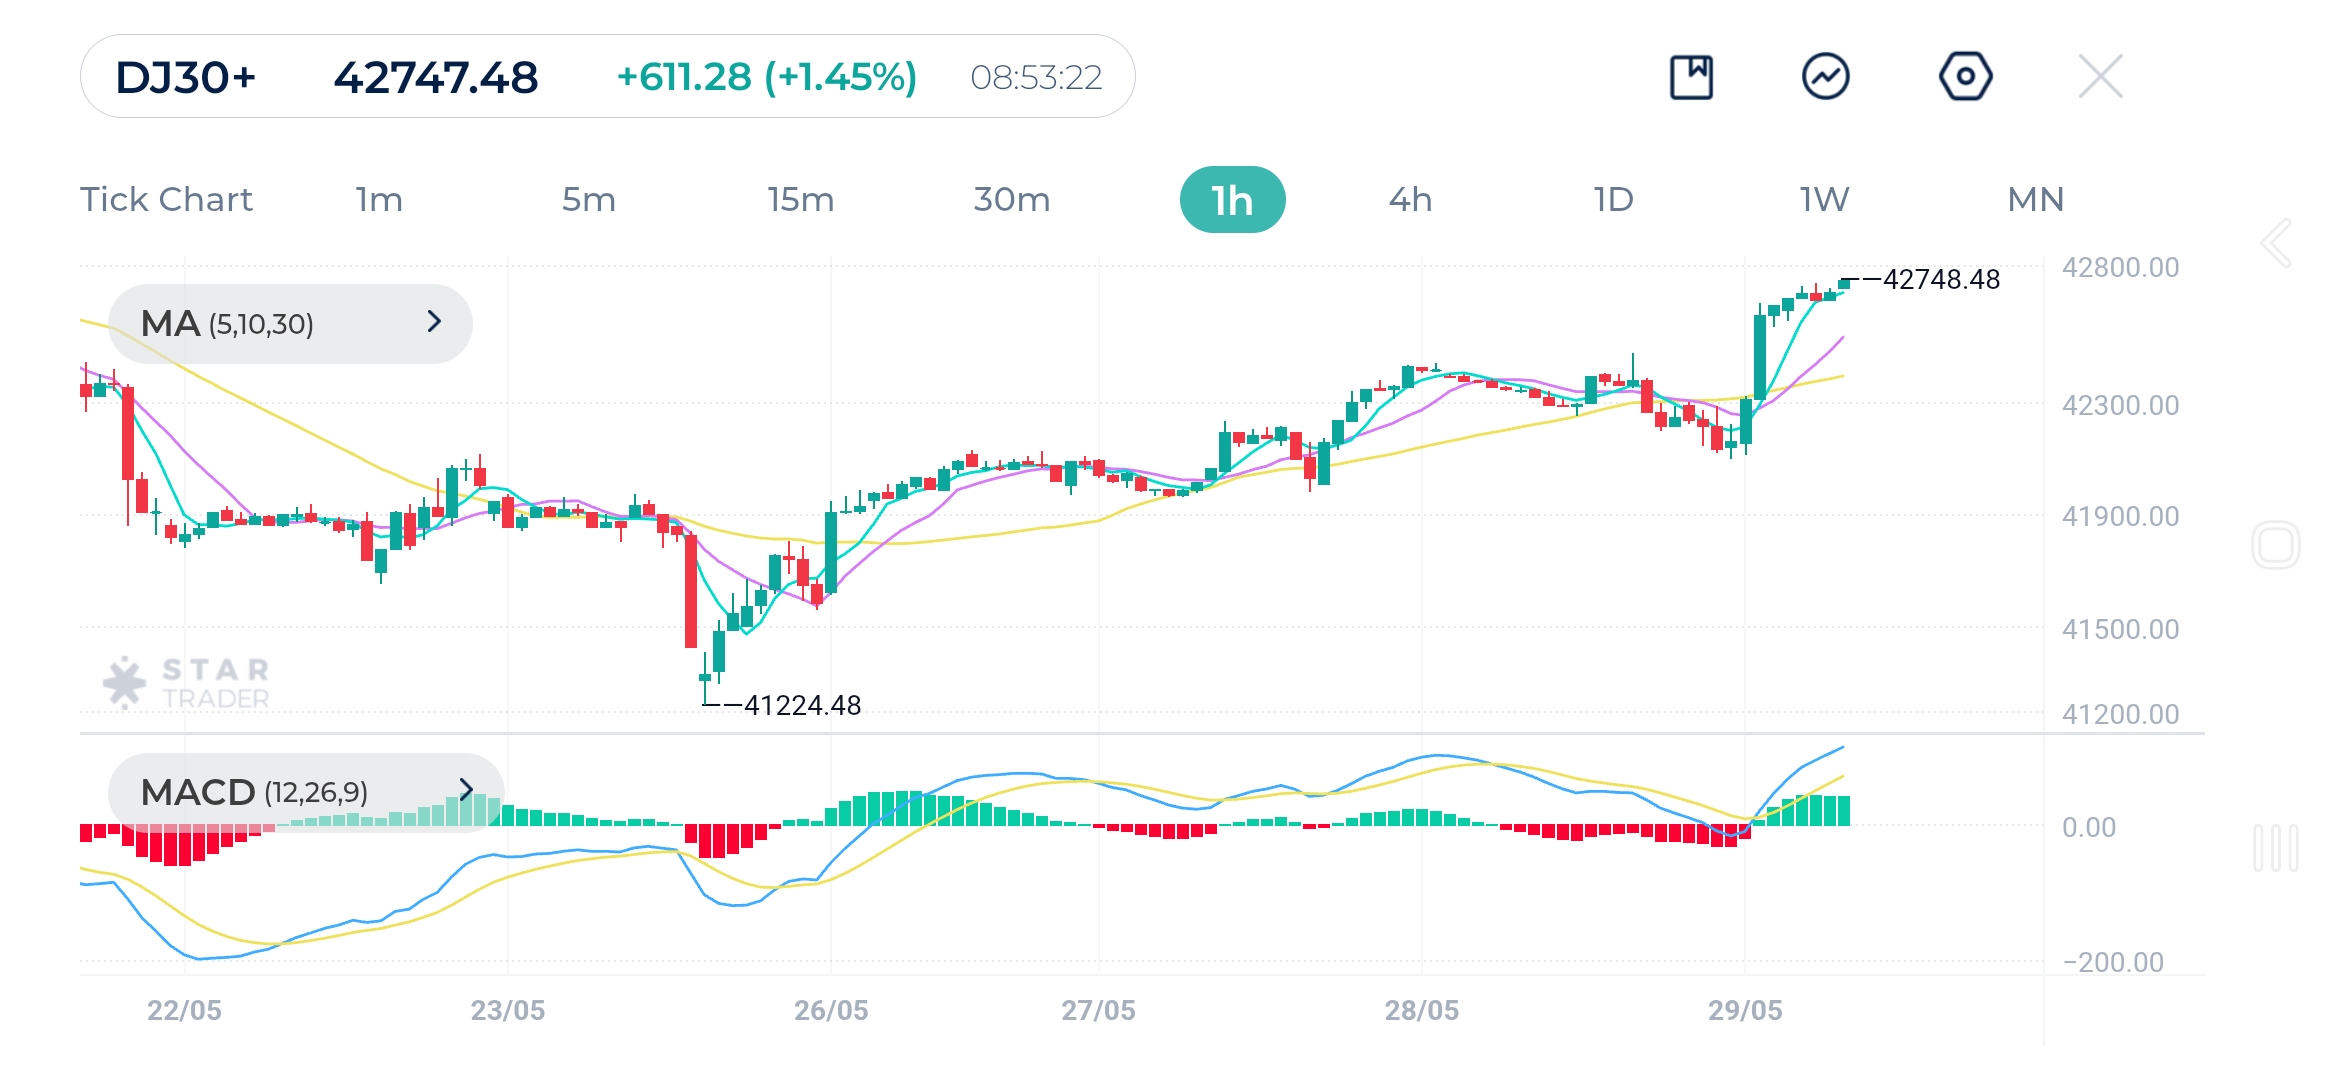
| Resistance | 42,817 | 42,884 | 42,955 |
| Support | 42,500 | 42,446 | 42,282 |
Tags
Open Live Account
Please enter a valid country
No results found
No results found
Please enter a valid email
Please enter a valid verification code
1. 8-16 characters + numbers (0-9) 2. blend of letters (A-Z, a-z) 3. special characters (e.g, !a#S%^&)
Please enter the correct format
Please tick the checkbox to proceed
Please tick the checkbox to proceed
Important Notice
STARTRADER does not accept any applications from Australian residents.
To comply with regulatory requirements, clicking the button will redirect you to the STARTRADER website operated by STARTRADER PRIME GLOBAL PTY LTD (ABN 65 156 005 668), an authorized Australian Financial Services Licence holder (AFSL no. 421210) regulated by the Australian Securities and Investments Commission.
CONTINUEImportant Notice for Residents of the United Arab Emirates
In alignment with local regulatory requirements, individuals residing in the United Arab Emirates are requested to proceed via our dedicated regional platform at startrader.ae, which is operated by STARTRADER Global Financial Consultation & Financial Analysis L.L.C.. This entity is licensed by the UAE Securities and Commodities Authority (SCA) under License No. 20200000241, and is authorised to introduce financial services and promote financial products in the UAE.
Please click the "Continue" button below to be redirected.
CONTINUEError! Please try again.