
Gold 4H chart shows short-term pullback after reaching a recent high at $3,450. Price recently dropped below the moving averages MA(5) and MA(10). While mid-term moving average MA(30) MA acts as dynamic support.
Bearish crossover occurred on the MACD, confirming a downward correction.
As long as the price holds above the 30-period MA, the medium-term uptrend remains intact. Watch for support around 3360–3380 and potential rebound signs like bullish reversal candelsticks.
Gold (XAUUSD) 4H Chart
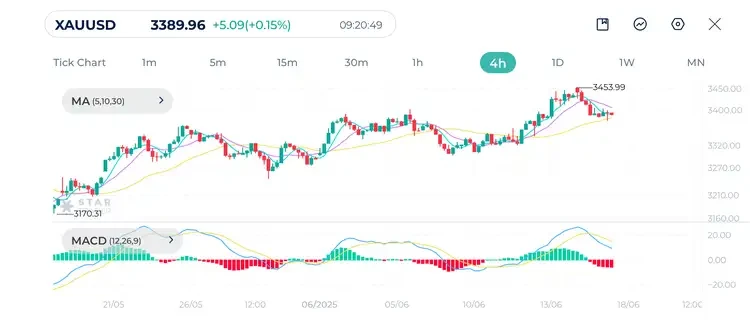
| Resistance | $3,403 | $3,412 | $3,435 |
| Support | $3,373 | $3,357 | $3,338 |
Oil has pulled back from a strong resistance at $77.35 on West Texas Intemediate. The current trend is still bullish, but if price falls below $70.50–$71.00 levels, it could trigger further correction. Price is still above the 30 MA, indicating bullish medium-term trend.
MACD shows a bearish crossover. Momentum is cooling off after a strong rally. Watch for either a bounce or breakdown below $70.
West Texas Intermediate 4H Chart
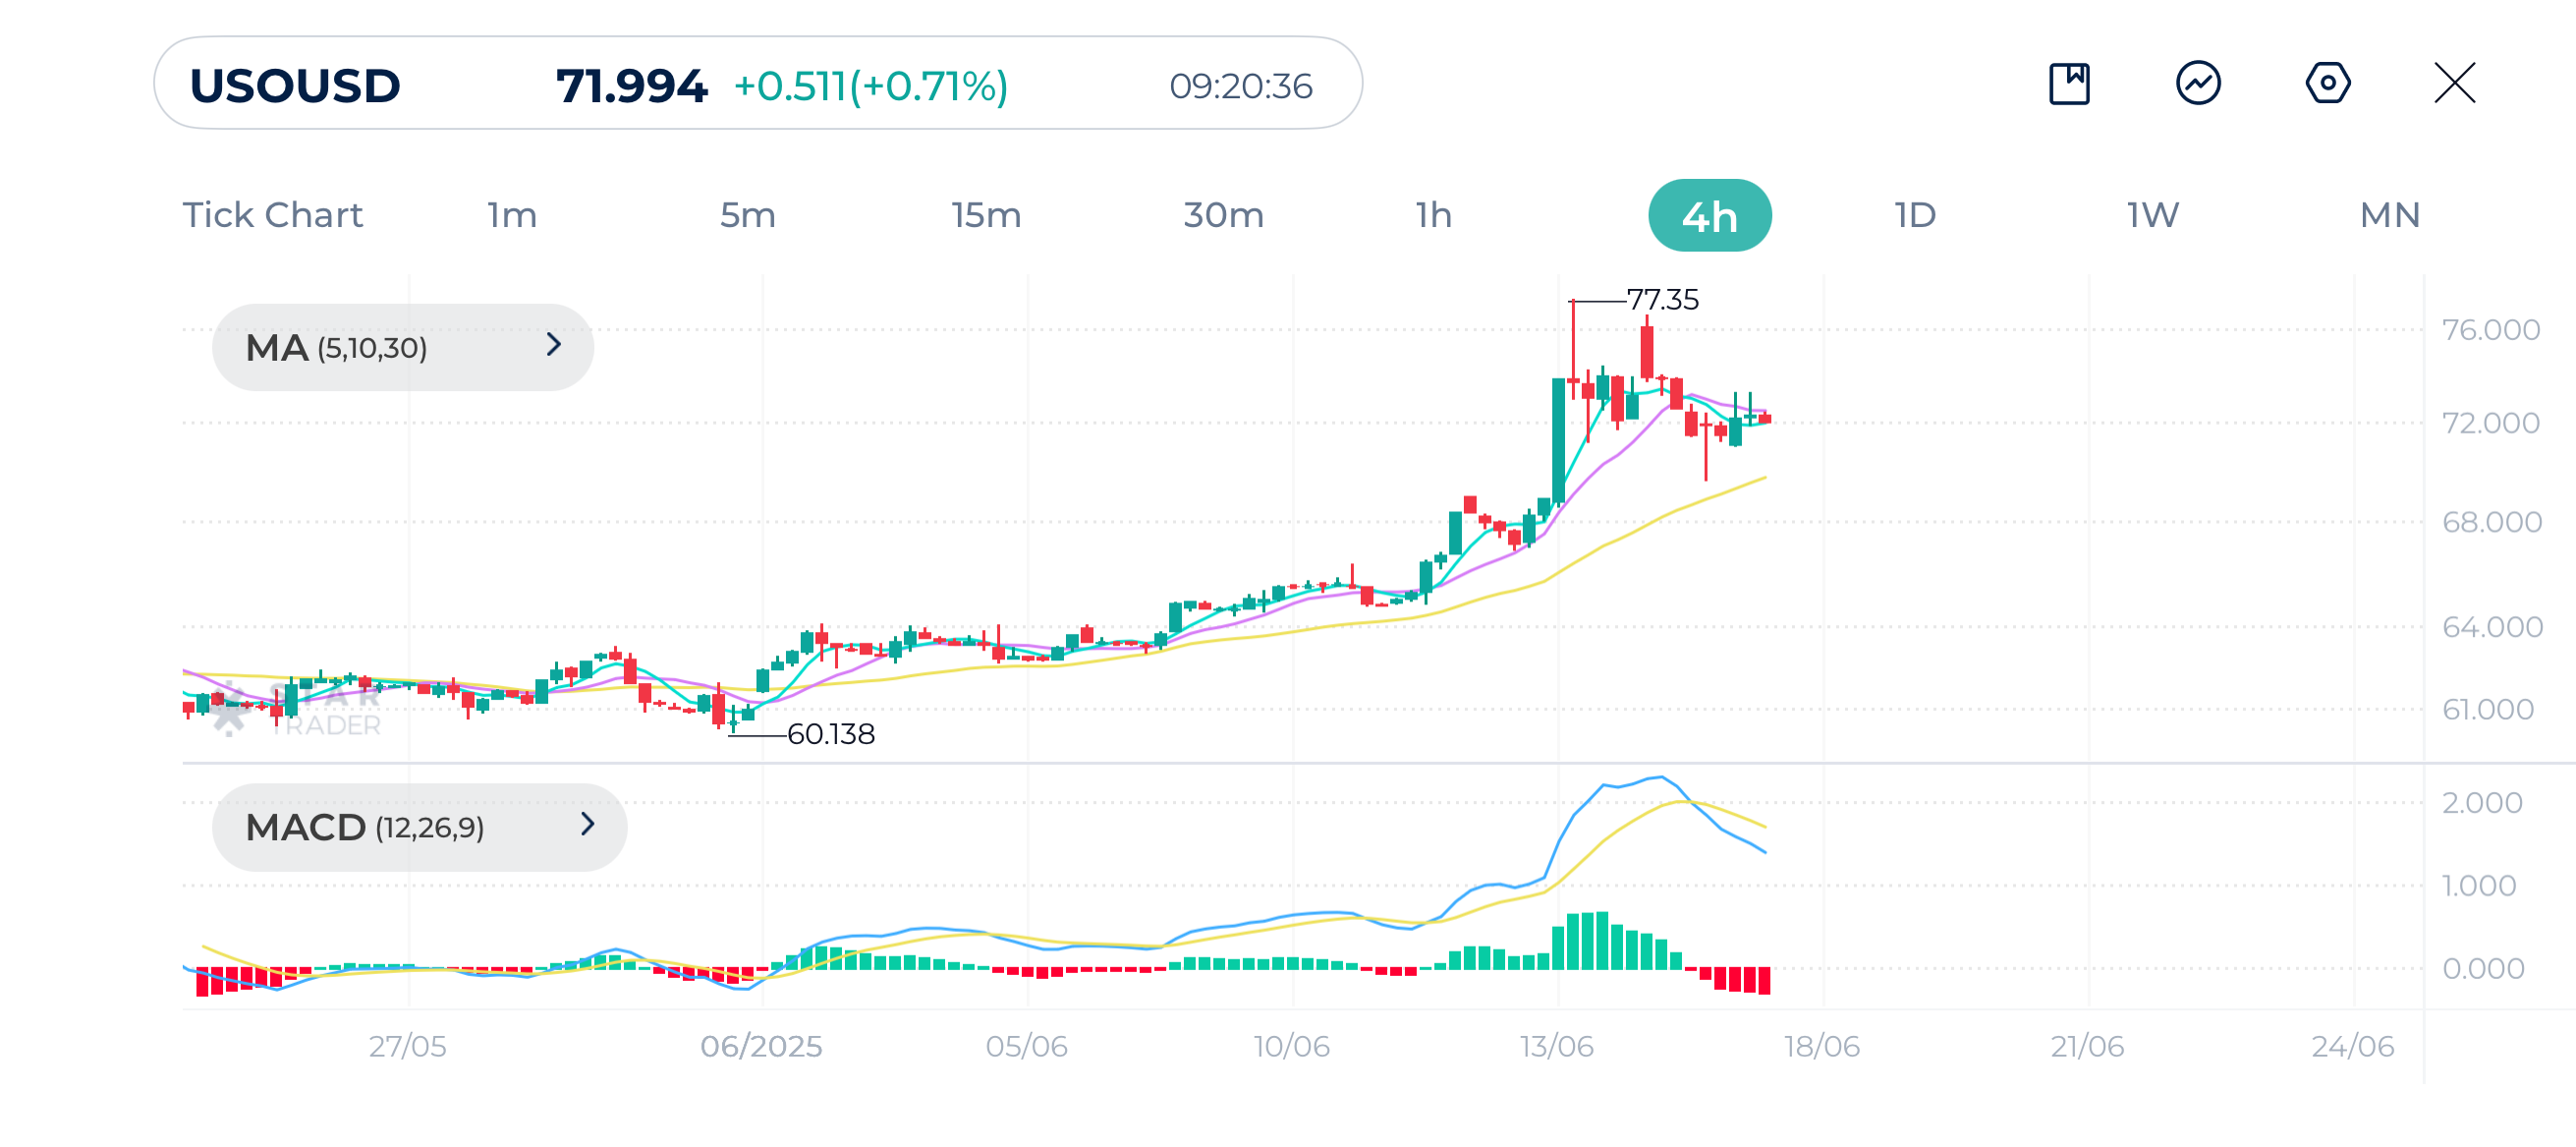
| Resistance | $70.85 | $71.64 | $72.63 |
| Support | $69.44 | $68.46 | $67.82 |
EUR/USD is in a consolidation phase after a spike to 1.1620. The price is struggling to break above or below the current range (1.1530–1.1580). Momentum is neutral to slightly bearish.
MACD shows converging lines after bearish momentum. The indicator suggests a possible reversal or consolidation.
EURUSD 1H Chart
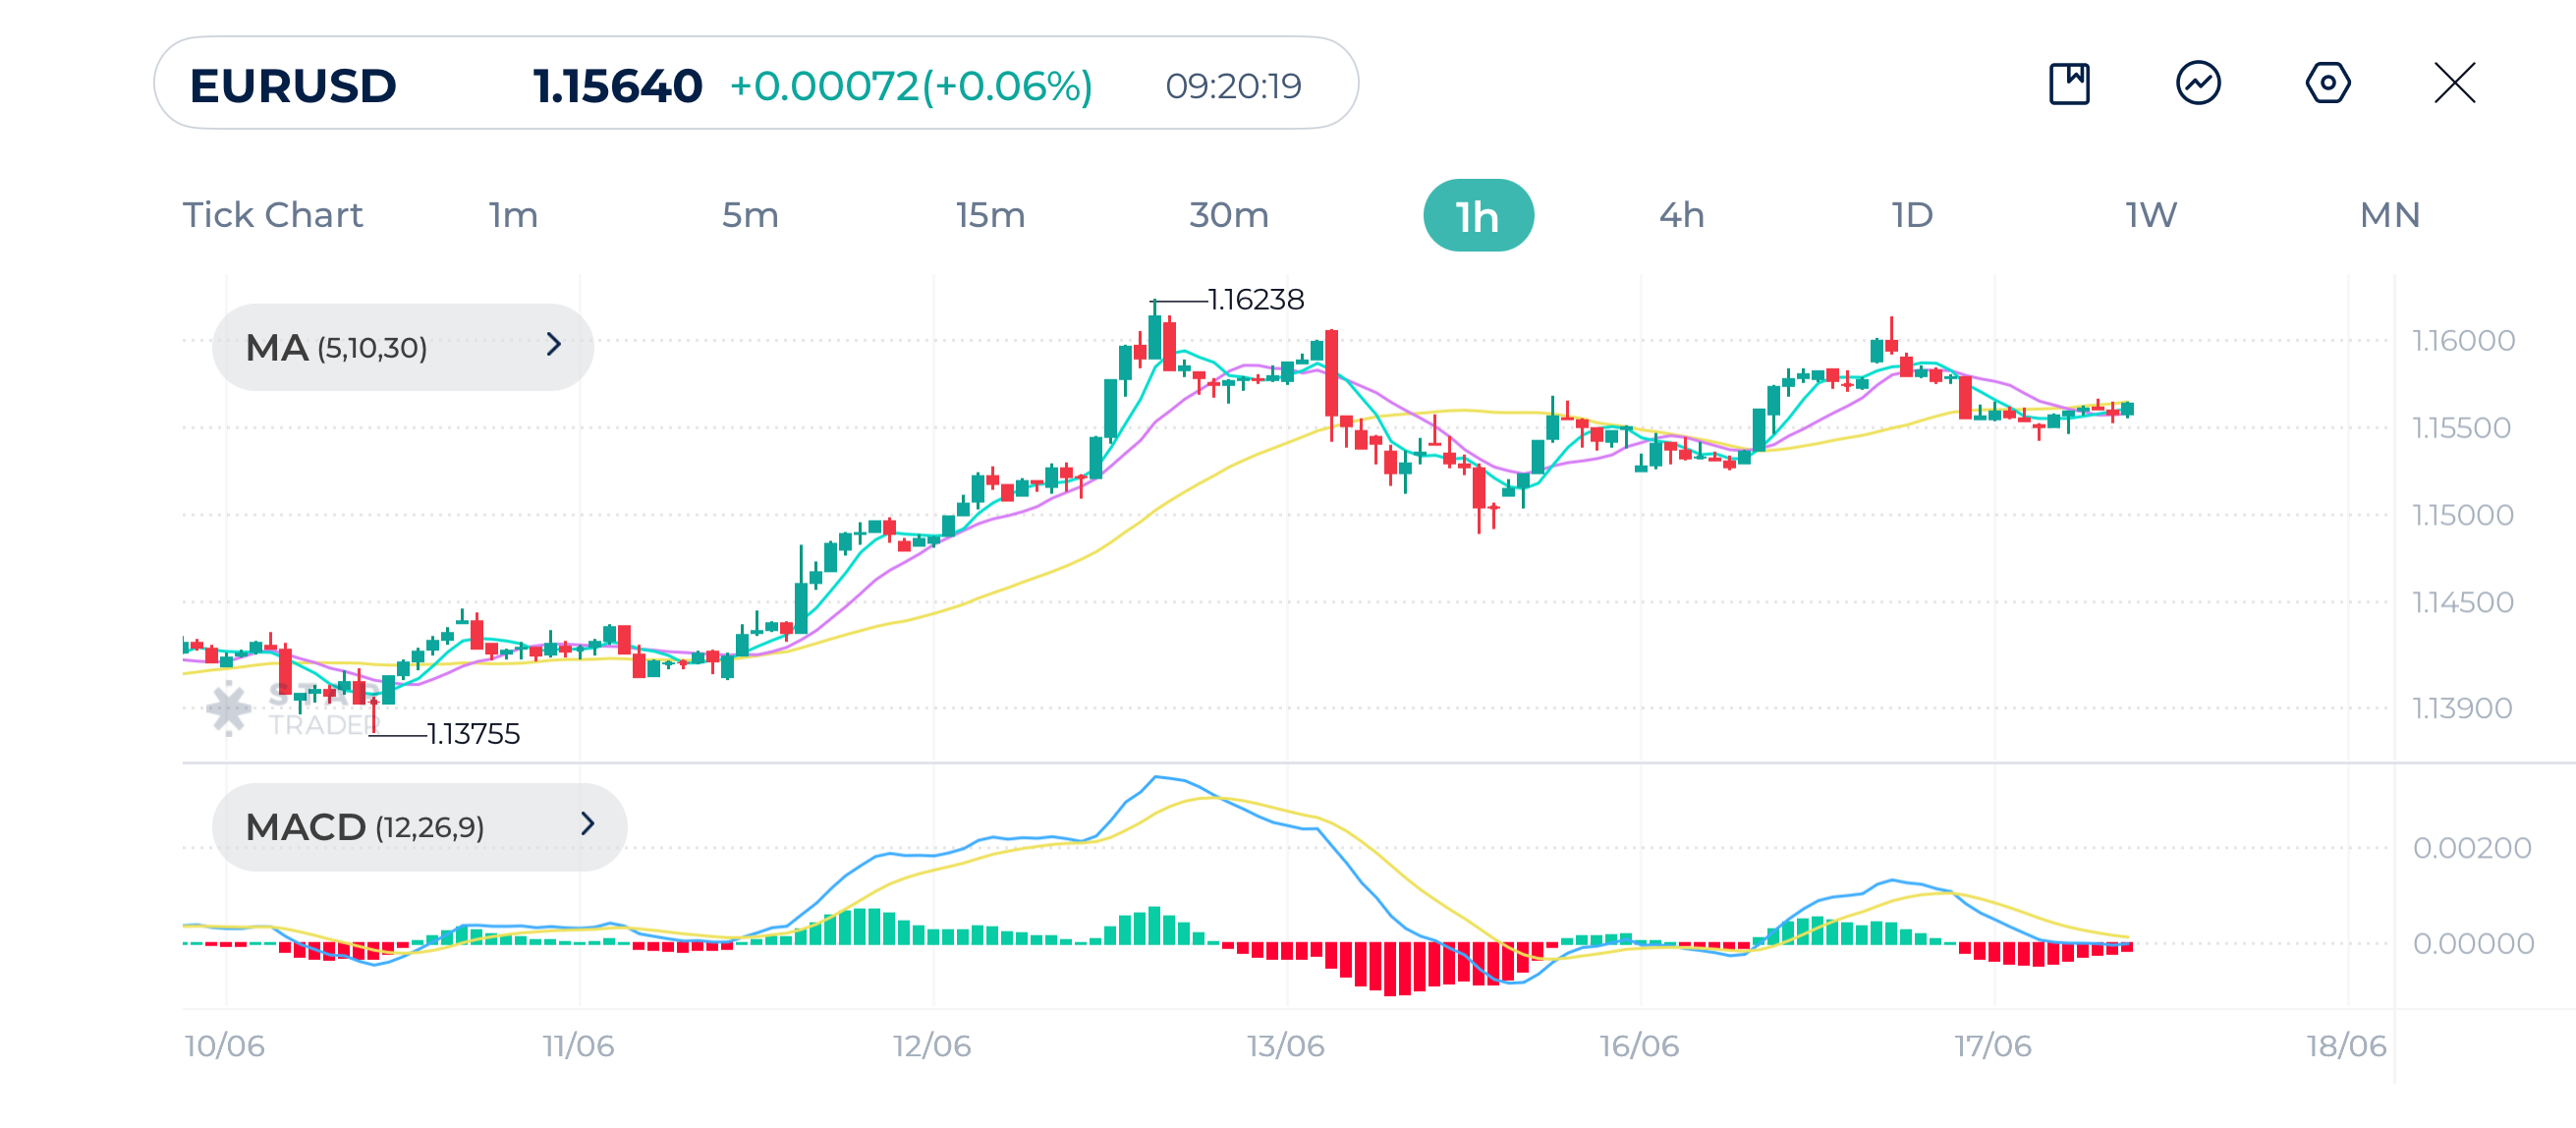
| Resistance | 1.1573 | 1.1586 | 1.1615 |
| Support | 1.1552 | 1.1536 | 1.1489 |
Tags
Open Live Account
Please enter a valid country
No results found
No results found
Please enter a valid email
Please enter a valid verification code
1. 8-16 characters + numbers (0-9) 2. blend of letters (A-Z, a-z) 3. special characters (e.g, !a#S%^&)
Please enter the correct format
Please tick the checkbox to proceed
Please tick the checkbox to proceed
Important Notice
STARTRADER does not accept any applications from Australian residents.
To comply with regulatory requirements, clicking the button will redirect you to the STARTRADER website operated by STARTRADER PRIME GLOBAL PTY LTD (ABN 65 156 005 668), an authorized Australian Financial Services Licence holder (AFSL no. 421210) regulated by the Australian Securities and Investments Commission.
CONTINUEImportant Notice for Residents of the United Arab Emirates
In alignment with local regulatory requirements, individuals residing in the United Arab Emirates are requested to proceed via our dedicated regional platform at startrader.ae, which is operated by STARTRADER Global Financial Consultation & Financial Analysis L.L.C.. This entity is licensed by the UAE Securities and Commodities Authority (SCA) under License No. 20200000241, and is authorised to introduce financial services and promote financial products in the UAE.
Please click the "Continue" button below to be redirected.
CONTINUEError! Please try again.