
Dow Jones 1H Chart
Dow Jones Industrial Average shows bullish momentum today with all short term and mid term moving averages trending upward on the hourly chart. The index might face resistance at the 41,451 level, which represents the monthly high.
Breaking and closing above this level on the hourly chart will indicate buying pressure is then expected to push prices higher towards 41,560
RSI is approaching the overbought zone, but still mostly neutral. A strong decline below 41,000 psychological level might put more pressure on the index, bringing it to the 40,800 level.
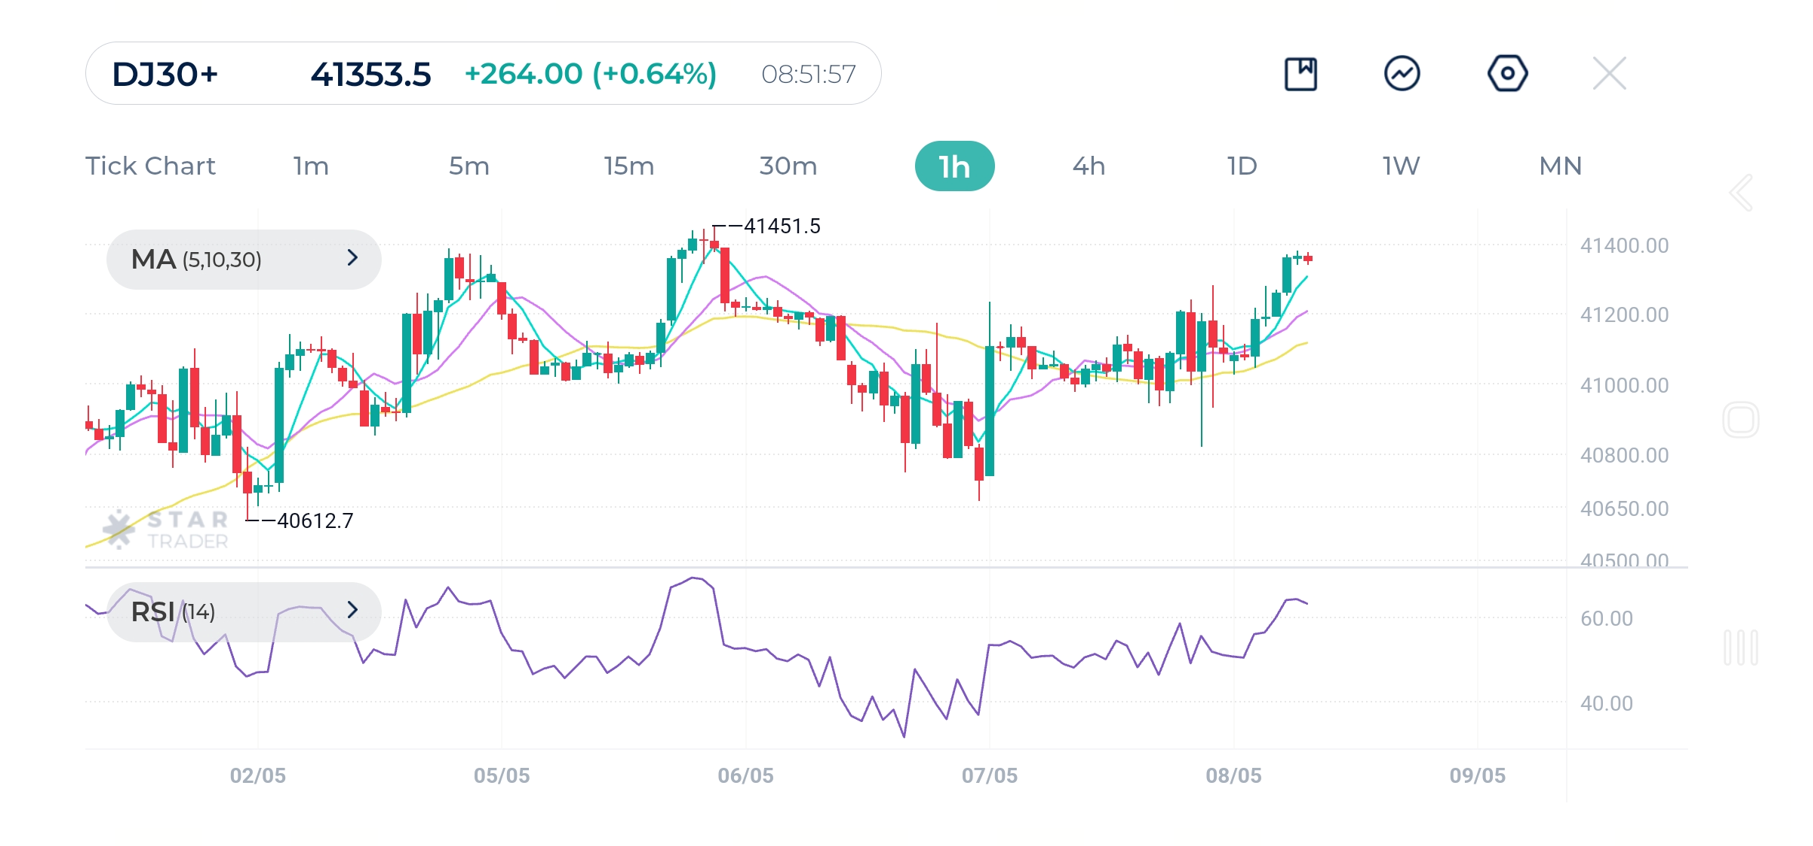
| Resistance关键支撑 | 41,451 | 41,560 | 41,751 |
| Support 阻力位 | 41,280 | 41,133 | 41,021 |
Brent UKOUSD 4H Chart
Oil prices have recovered from the sharp fall at the beginning of the month. The 4H chart shows clear short term downtrend. Moving averages MA(5), MA(10), and MA(30) show indecisiveness. RSI is moving in the neutral zone around 50.
The downward trendline is expected to hold prices below $64 levels. However, a strong break and close above the trendline will indicate a possible reversal upwards.
The major resistance level to watch out today is $63.75. If price fails to reach that level or shows bearish price action when approaching it, more declines are expected.
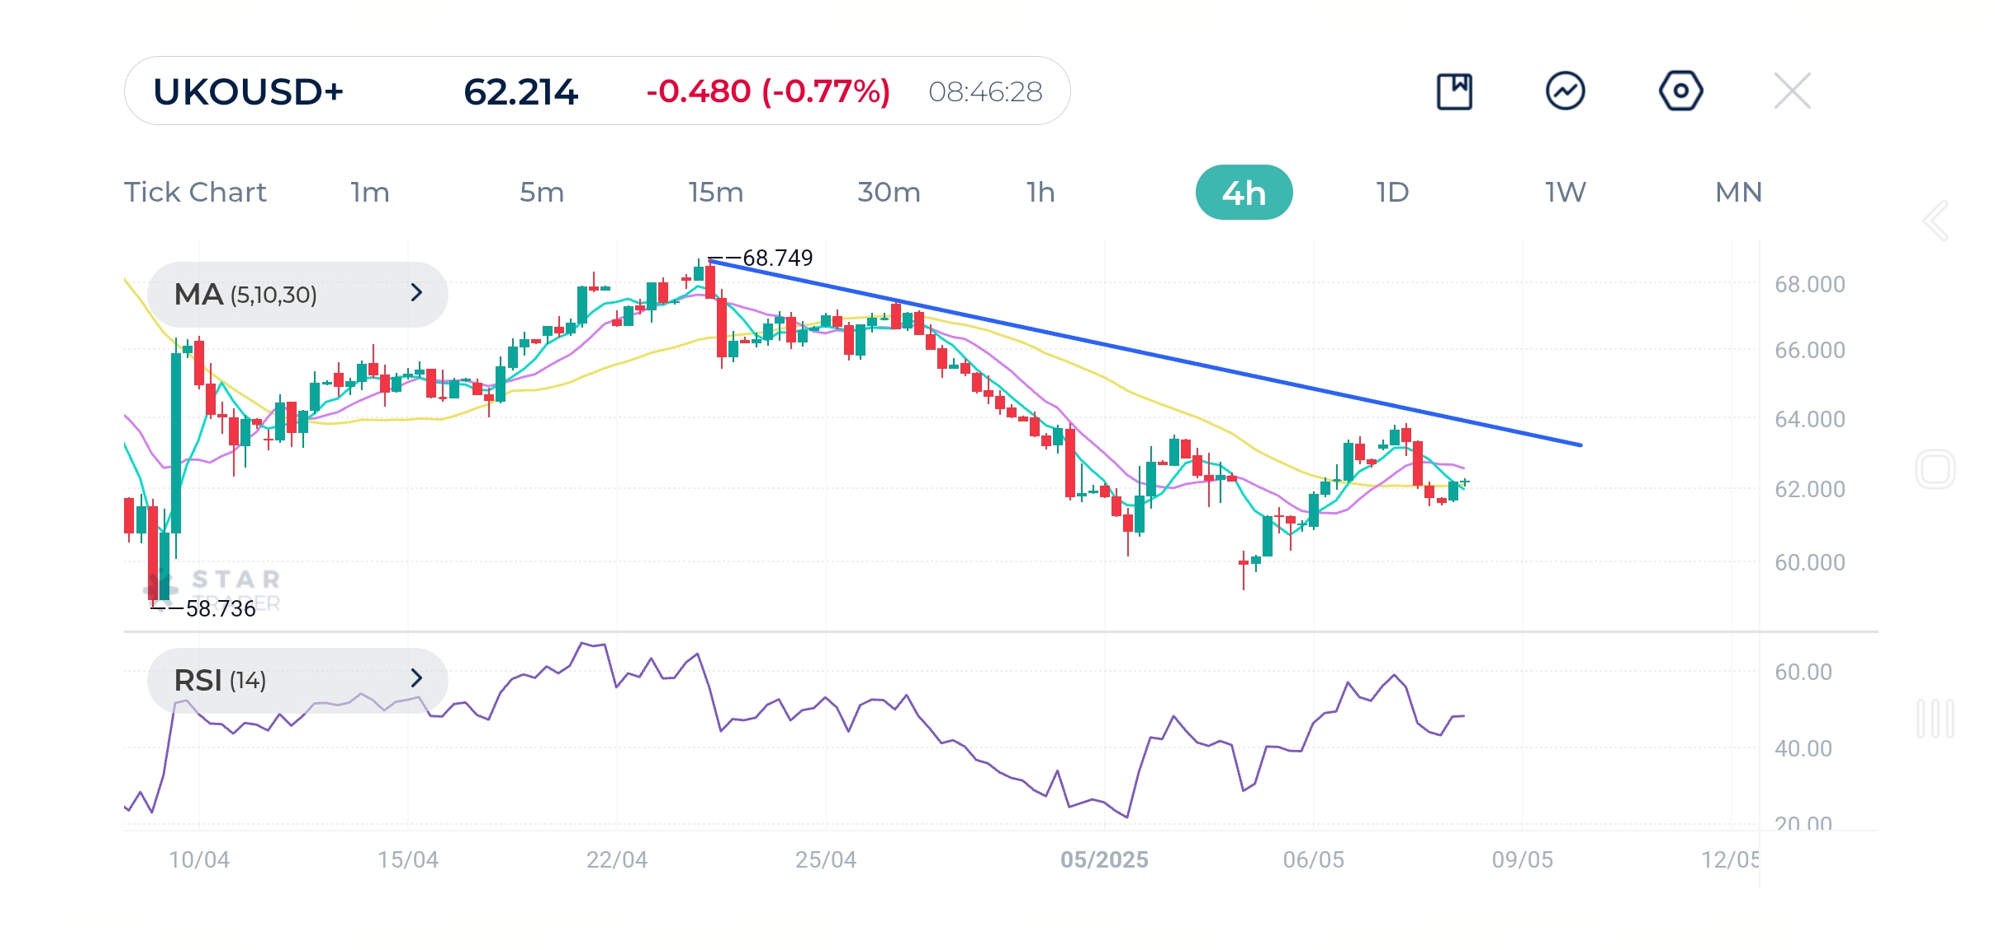
| Resistance关键支撑 | $62.12 | $63.05 | $63.68 |
| Support 阻力位 | $60.62 | $59.87 | $59.47 |
USDJPY 1H Chart
The USDJPY pair broke above the downtrend line on the hourly chart, indicating bullish momentum and buying pressure. Short term moving averages are trending upwards and providing dynamic support for the price.
The pair is expected to hold above 143.00 levels and push towards 145.00. Watch out for dynamic support represented by the moving average MA(30).
RSI still shows room for more bullish momentum.
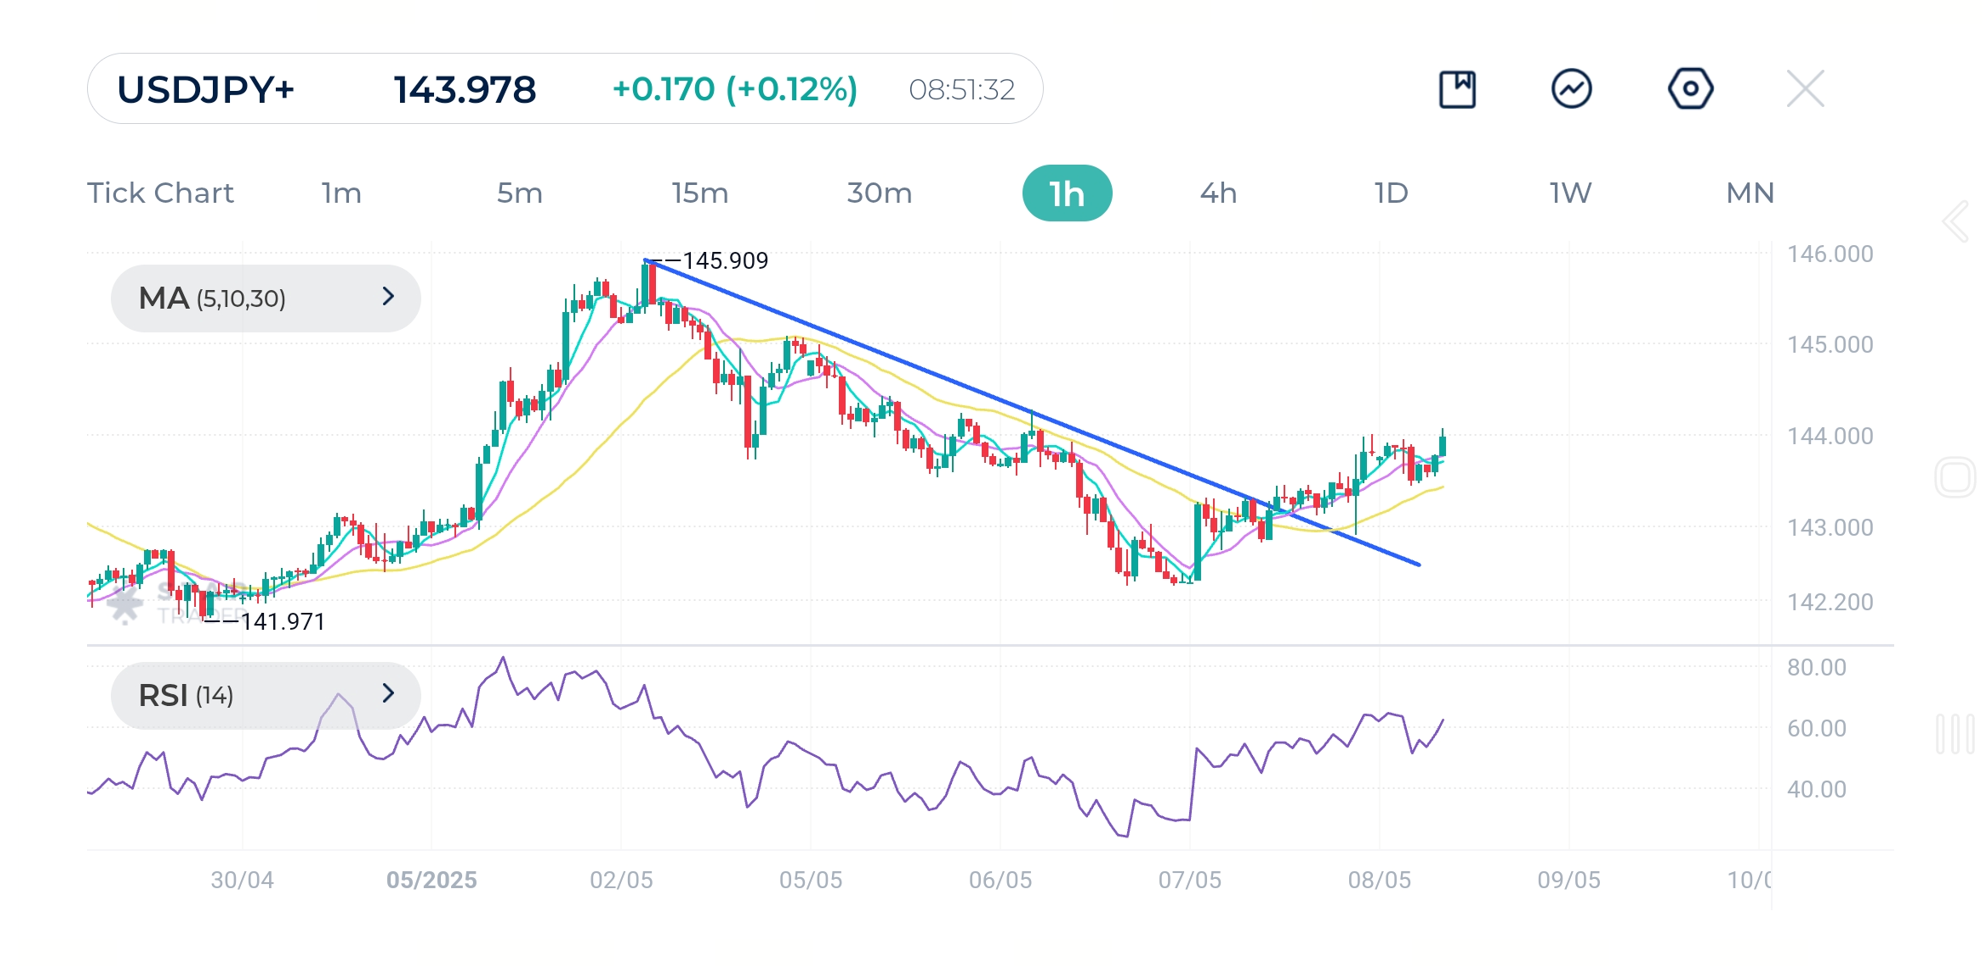
| Resistance关键支撑 | 144.28 | 144.43 | 145.08 |
| Support 阻力位 | 143.46 | 142.93 | 142.75 |
Tags
Open Live Account
Please enter a valid country
No results found
No results found
Please enter a valid email
Please enter a valid verification code
1. 8-16 characters + numbers (0-9) 2. blend of letters (A-Z, a-z) 3. special characters (e.g, !a#S%^&)
Please enter the correct format
Please tick the checkbox to proceed
Please tick the checkbox to proceed
Important Notice
STARTRADER does not accept any applications from Australian residents.
To comply with regulatory requirements, clicking the button will redirect you to the STARTRADER website operated by STARTRADER PRIME GLOBAL PTY LTD (ABN 65 156 005 668), an authorized Australian Financial Services Licence holder (AFSL no. 421210) regulated by the Australian Securities and Investments Commission.
CONTINUEImportant Notice for Residents of the United Arab Emirates
In alignment with local regulatory requirements, individuals residing in the United Arab Emirates are requested to proceed via our dedicated regional platform at startrader.ae, which is operated by STARTRADER Global Financial Consultation & Financial Analysis L.L.C.. This entity is licensed by the UAE Securities and Commodities Authority (SCA) under License No. 20200000241, and is authorised to introduce financial services and promote financial products in the UAE.
Please click the "Continue" button below to be redirected.
CONTINUEError! Please try again.