
USD JPY shows a strong uptrend on the hourly chart, evidenced by a clear series of higher highs and higher lows. After bottoming around 141.75, price surged to a recent high near 145.91 before slightly pulling back.
The short-term MAs (5 and 10) are still above the 30-period MA, confirming bullish direction.
Price is slightly correcting but still above the 30 moving average, indicating this might be a healthy retracement. RSI shows a loss of momentum, but not a reversal yet.
As long as price remains above the 30 MA (around 144.50), buyers remain in control. It’s important to watch for support near 144.80–145.00 for potential bullish entries. A break below that could signal deeper correction.
USDJPY 1H Chart
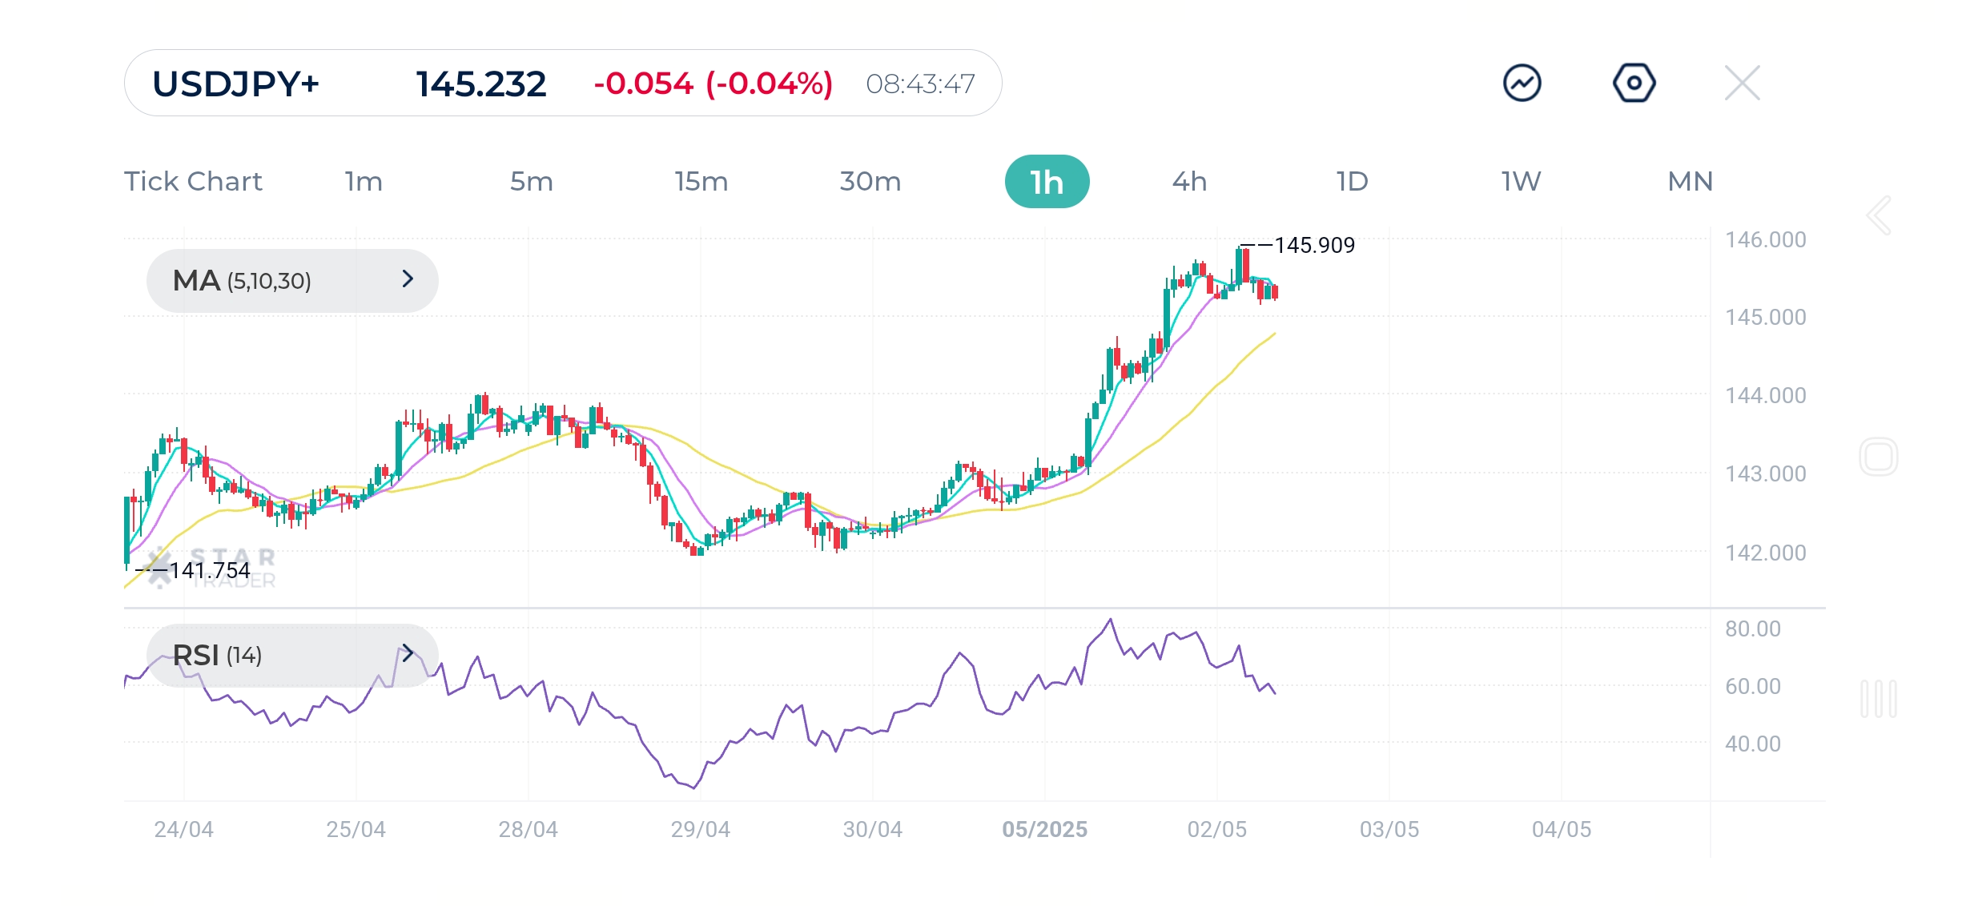
| Resistance | 145.93 | 146.45 | 147.16 |
| Support | 144.56 | 144.15 | 143.69 |
EURUSD is in a downtrend, confirmed by lower highs and lower lows. Trendline shows decline from the recent high of 1.1424. Short term moving averages are trending downward, though recent candles are attempting to break above the MA cluster, signaling a potential reversal attempt. Price is currently testing both the 10 and 30 MAs, a critical resistance zone.
RSI is recovering and approaching the 50–60 zone, indicating bullish bias, but not yet strong
A break and close above 1.1320–1.1340 (above moving averages + trendline) would be bullish for the pair, targeting 1.1370 and 1.1400. If it fails at this resistance, expect a retest of 1.1265 (recent low).
EURUSD 1H Chart
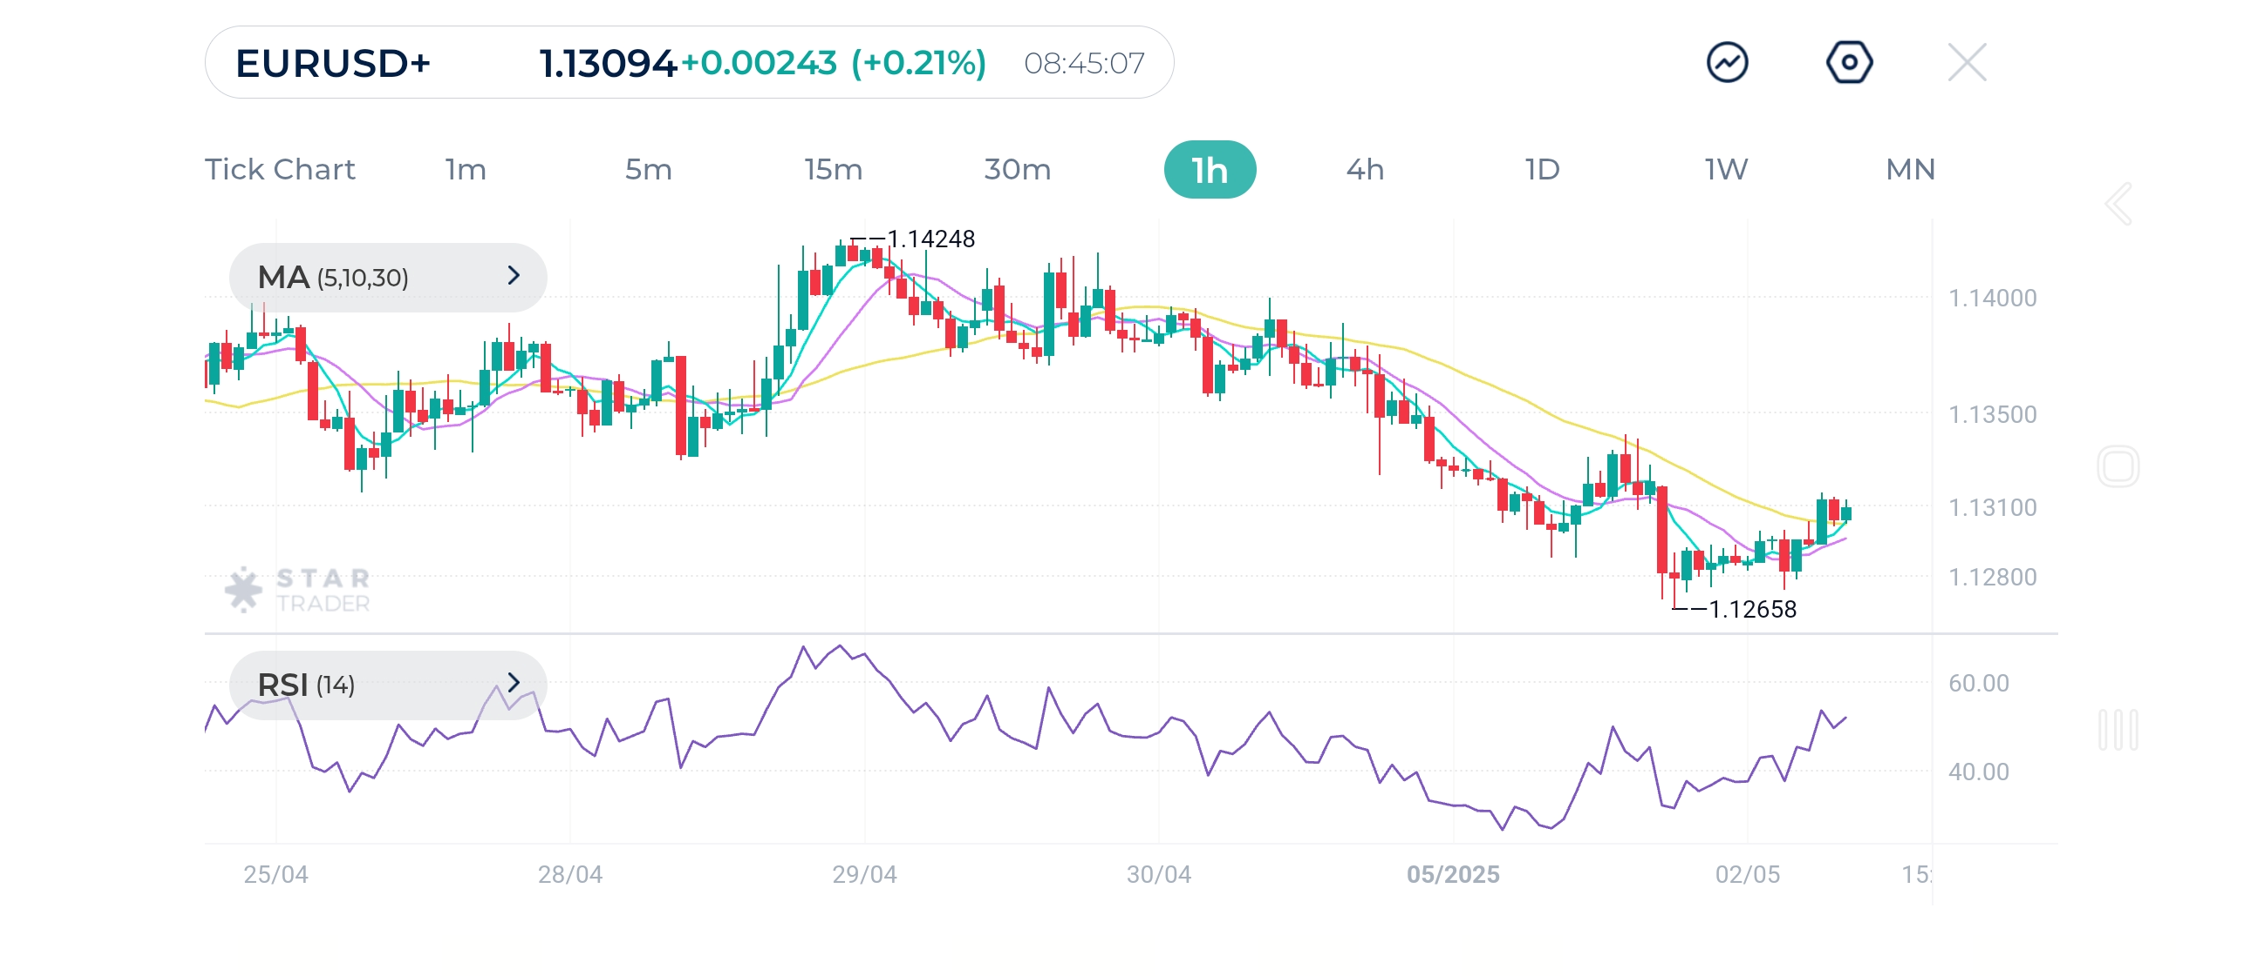
| Resistance | 1.1328 | 1.1341 | 1.1365 |
| Support | 1.1274 | 1.1266 | 1.1249 |
Oil shows Clear downtrend from 64.08 to 56.61, followed by a strong bounce. The bounce pushed price back to near $60, testing prior minor resistance.
Short term moving averages MAs (5 and 10) have crossed above the 30 moving average a bullish crossover. Price is consolidating just under 60.00, which might act as short-term resistance.
If price breaks and holds above $60, bullish movement is likely towards $61.50–62.00. However, failure to break may lead to a pullback to support at $58.50.
Oil1 H Chart
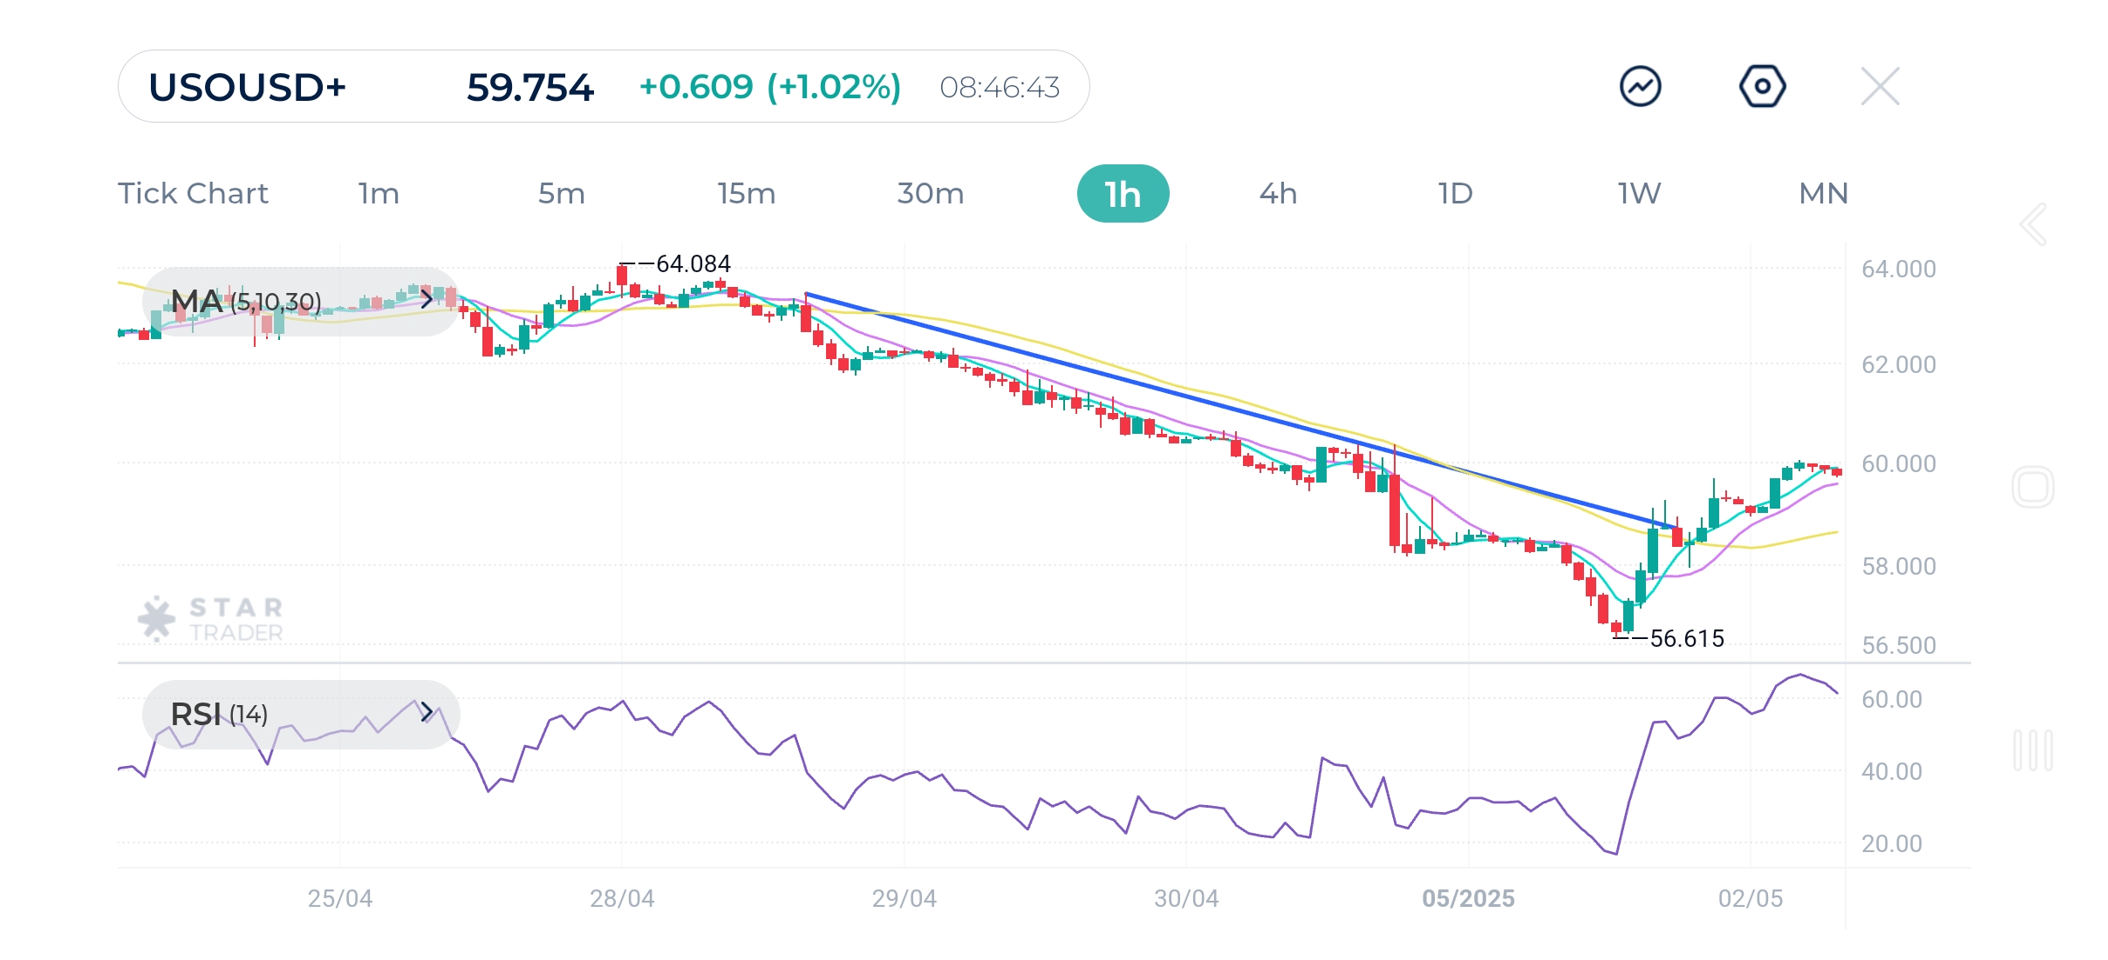
| Resistance | $59.83 | $60.13 | $60.81 |
| Support | $58.42 | $57.48 | $56.67 |
Tags
Open Live Account
Please enter a valid country
No results found
No results found
Please enter a valid email
Please enter a valid verification code
1. 8-16 characters + numbers (0-9) 2. blend of letters (A-Z, a-z) 3. special characters (e.g, !a#S%^&)
Please enter the correct format
Please tick the checkbox to proceed
Please tick the checkbox to proceed
Important Notice
STARTRADER does not accept any applications from Australian residents.
To comply with regulatory requirements, clicking the button will redirect you to the STARTRADER website operated by STARTRADER PRIME GLOBAL PTY LTD (ABN 65 156 005 668), an authorized Australian Financial Services Licence holder (AFSL no. 421210) regulated by the Australian Securities and Investments Commission.
CONTINUEImportant Notice for Residents of the United Arab Emirates
In alignment with local regulatory requirements, individuals residing in the United Arab Emirates are requested to proceed via our dedicated regional platform at startrader.ae, which is operated by STARTRADER Global Financial Consultation & Financial Analysis L.L.C.. This entity is licensed by the UAE Securities and Commodities Authority (SCA) under License No. 20200000241, and is authorised to introduce financial services and promote financial products in the UAE.
Please click the "Continue" button below to be redirected.
CONTINUEError! Please try again.