
The Euro continues to decline against the US dollar with a clear downtrend despite a short bullish correction seen on the hourly chart. The pair witnessed a sharp decline in yesterday’s trading following solid fundamentals that supported the US dollar.
Price is now trading below the 30-period moving average, but trying to test it from below. The 5 and 10 moving averages are nearing crossing upwards, signaling a short-term bullish attempt.
RSI is rising from oversold levels, currently near neutral levels. This shows the bearish momentum is weakening but not yet bullish.
Key Levels to watch in today’s session are:
- Support: 1.1065 (represents recent low)
- Resistance: 1.1130 and 1.1180 (price may retest these levels if upward correction continues)
Sellers remains in control, but we’re seeing a corrective pullback. If price fails to break above the 30 moving average, this will give an indication for more declines.
EURUSD 1H Chart
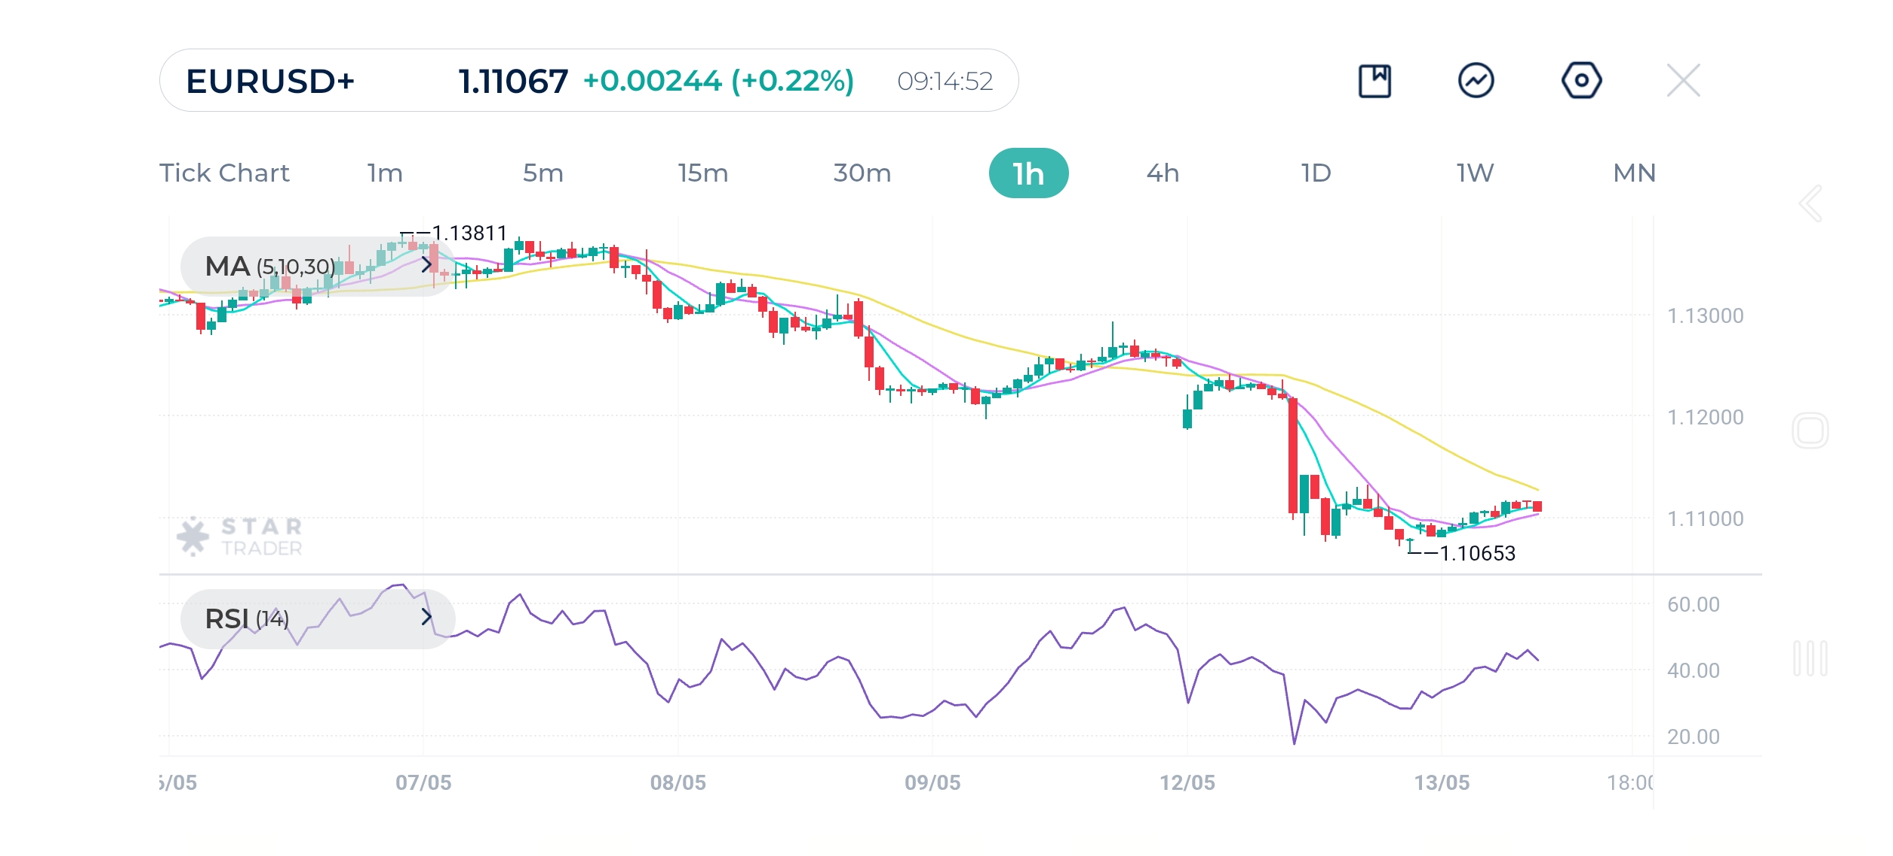
| Resistance | 1.1134 | 1.1194 | 1.1243 |
| Support | 1.1065 | 1.1018 | 1.0964 |
Gold (XAUUSD) 1H Chart
Gold has been declining noticeably since last week, but a bullish bounce might be in progress.
Short term moving averages are crossing upward, and price is approaching the 30 moving average. Momentum is improving.
RSI i rising sharply, now near 55 — suggests bullish strength is returning after hitting 3209.
Key Levels to watch in today’s session are:
- Support: 3209
- Resistance: 3280 and 3310
Short-term bullish correction within a larger bearish move. A break above 3280 and sustained move above 30 moving average could open the door to 3310–3330 zone.
| Resistance | $3,277 | $3,295 | $3,320 |
| Support | $3,215 | $3,207 | $3,192 |
USDJPY is still bullish but, currently moving in a consolidation phase due to the price correction. Price is just at the 30-period moving average. The 5 and 10 are sloping downward, hinting at a ossible short-term correction .
RSI (14) is dropping, currently around 50 — showing cooling off after a strong bullish move.
Key Levels to watch in today’s session are:
- Support: 147.50 and 146.90
- Resistance: 148.60
The pair is still bullish overall, but likely in a short-term retracement at the time being. Watch for a bounce near 147.50–147.70 to confirm trend continuation upward.
USDJPY 1H Chart
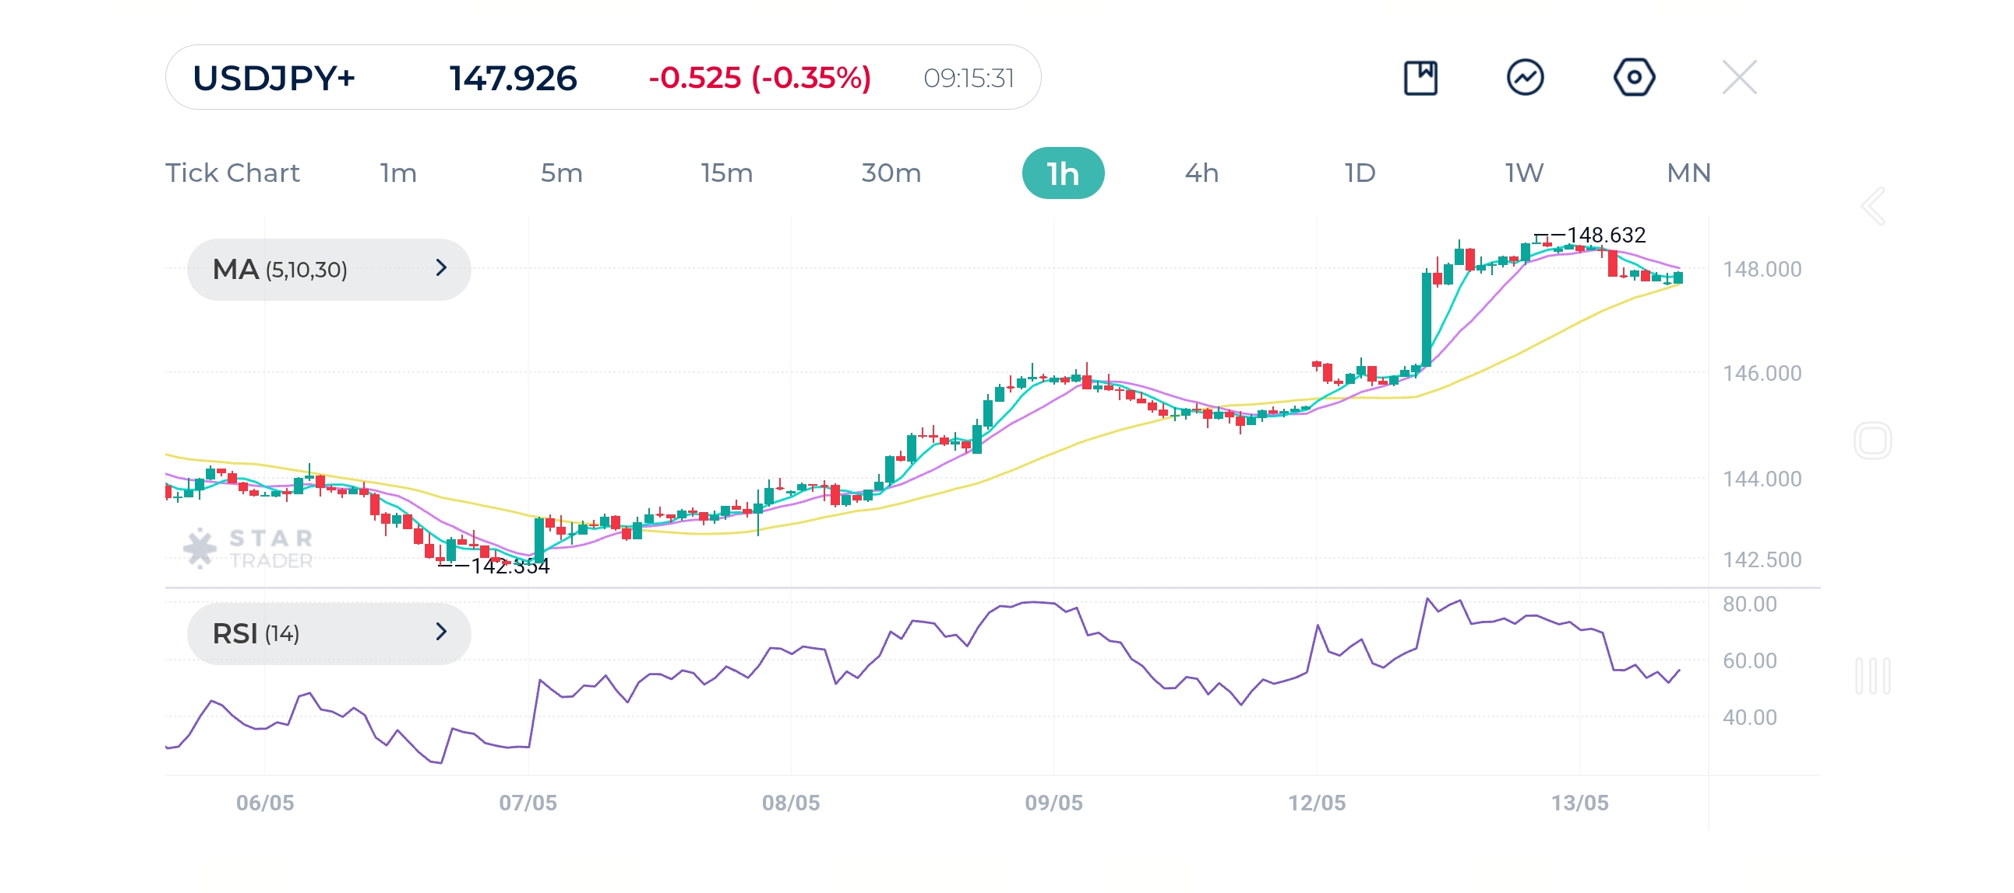
| Resistance | 148.65 | 149.13 | 149.90 |
| Support | 147.19 | 146.45 | 146.19 |
Tags
Open Live Account
Please enter a valid country
No results found
No results found
Please enter a valid email
Please enter a valid verification code
1. 8-16 characters + numbers (0-9) 2. blend of letters (A-Z, a-z) 3. special characters (e.g, !a#S%^&)
Please enter the correct format
Please tick the checkbox to proceed
Please tick the checkbox to proceed
Important Notice
STARTRADER does not accept any applications from Australian residents.
To comply with regulatory requirements, clicking the button will redirect you to the STARTRADER website operated by STARTRADER PRIME GLOBAL PTY LTD (ABN 65 156 005 668), an authorized Australian Financial Services Licence holder (AFSL no. 421210) regulated by the Australian Securities and Investments Commission.
CONTINUEImportant Notice for Residents of the United Arab Emirates
In alignment with local regulatory requirements, individuals residing in the United Arab Emirates are requested to proceed via our dedicated regional platform at startrader.ae, which is operated by STARTRADER Global Financial Consultation & Financial Analysis L.L.C.. This entity is licensed by the UAE Securities and Commodities Authority (SCA) under License No. 20200000241, and is authorised to introduce financial services and promote financial products in the UAE.
Please click the "Continue" button below to be redirected.
CONTINUEError! Please try again.